HireTrack NX has its own built in reports editor based on the Reportbuilder Engine. It allows the creation and modification of reports.
Whilst it is out of the scope of the manual to deal with complex report generation, The procedure of modifying reports is documented here and more documentation on the advanced use of the reports designer can be found at ![]()
Modifying a report - Making simple changes.
First you access the report through the Data Outputs>Reporting Designer tab. .

This brings up a report navigator window that allows you to navigate to a specific report
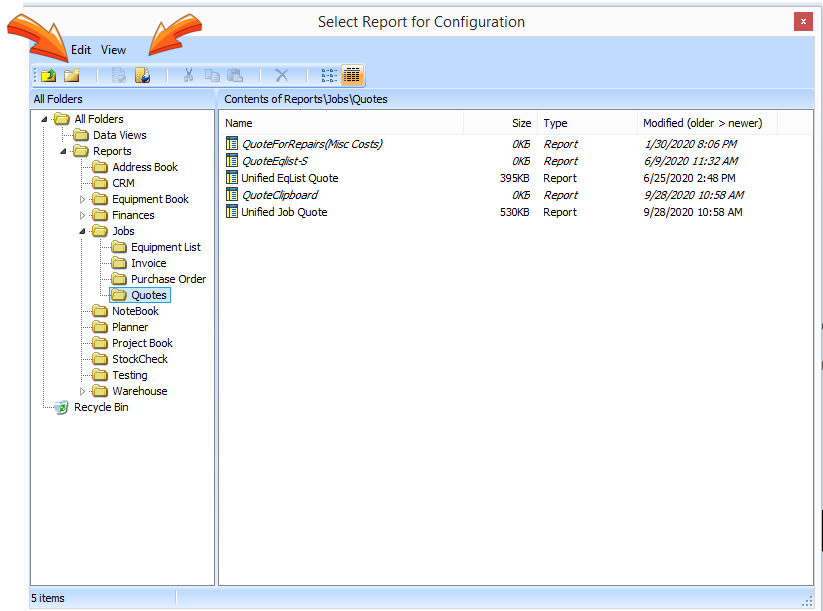
Double clicking on a report brings up the report editor
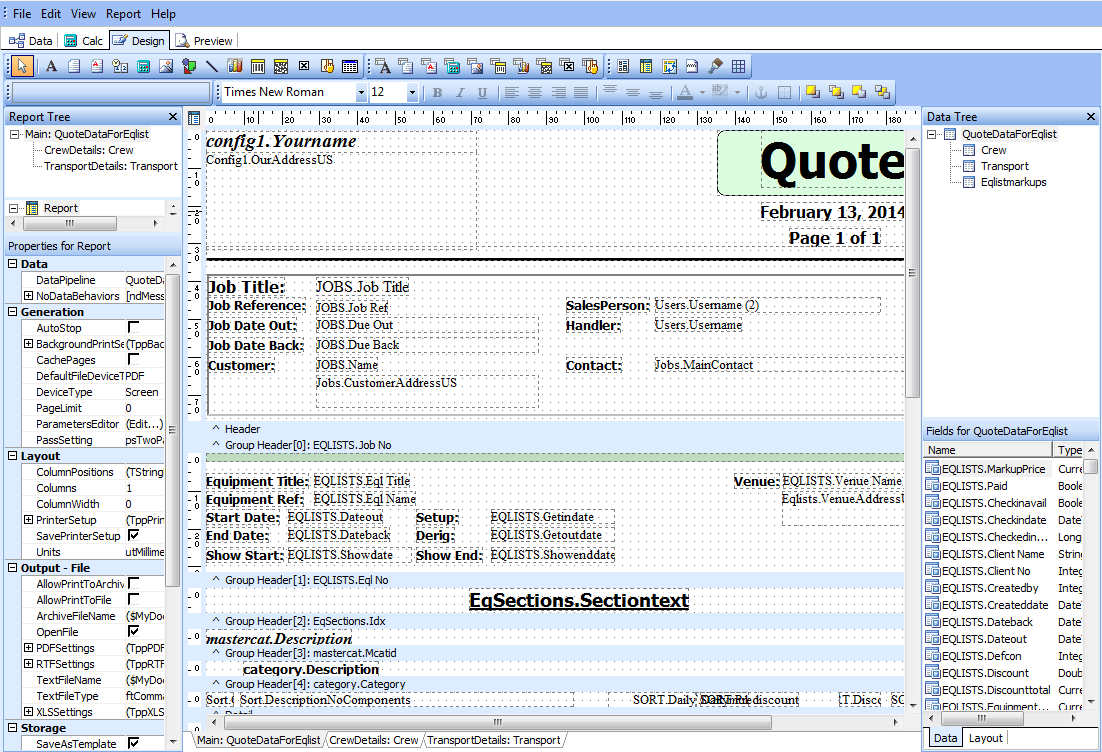
This is the report in design time view - you can see the basic layout report with tool windows either side.
At the top of the screen are the toolbars that allow you to select which kind of object you wish to add to the report.
The first bar indicates 'non data aware' items - basically objects that do not get information from the database - such as labels and boxes for notes and shapes, the second set are data aware whose data is gained by accessing the database - these are the same icons with a table symbol in the background and can be used to display data from the database such as the job name.

On the left is the properties window, this sets the properties of the currently selected object
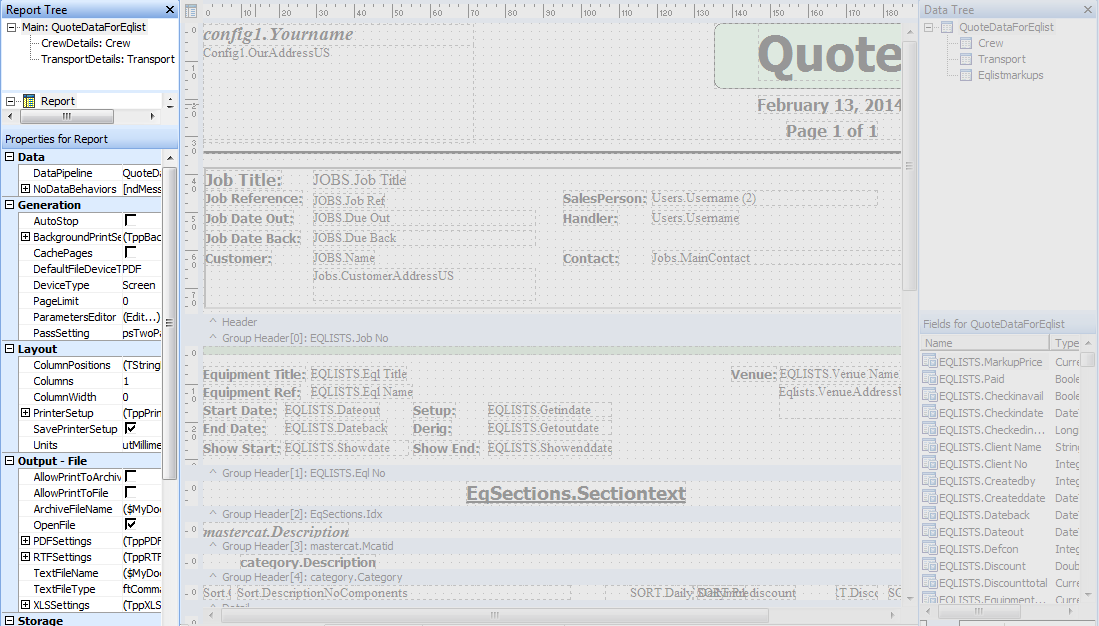
On the right hand side are the sources of data from the database
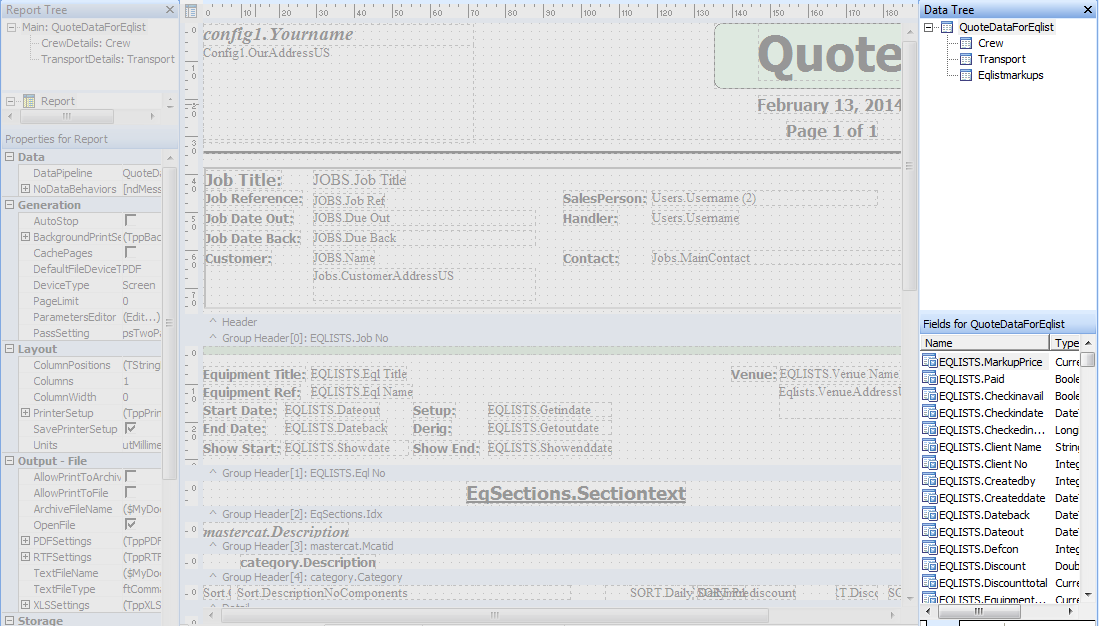
and in the centre is the report itself
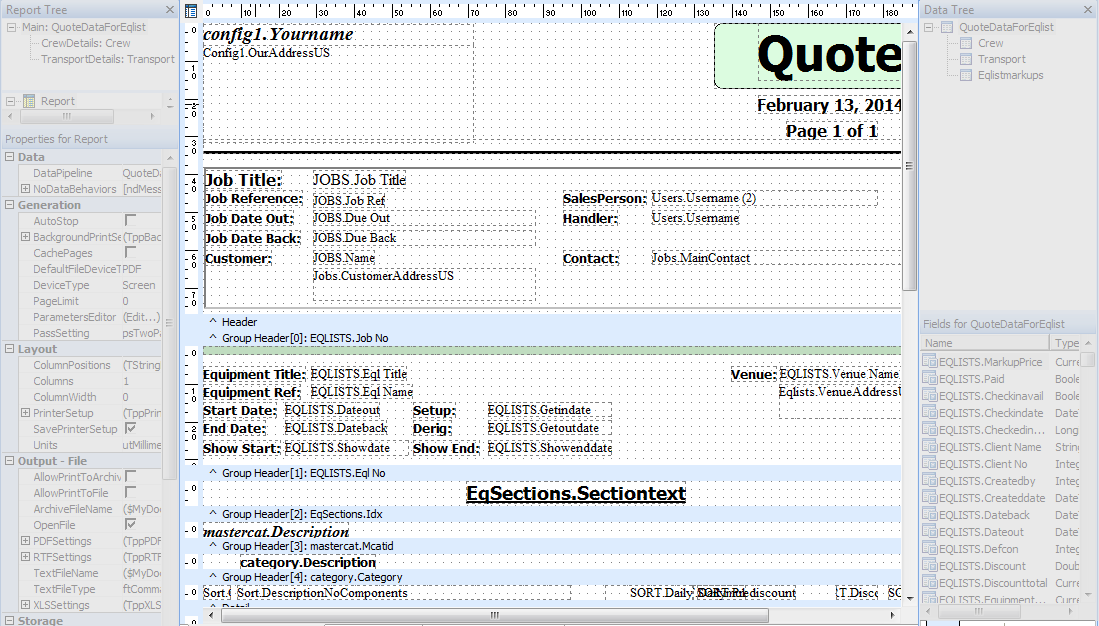
Adding a Logo and changing colours
This largely involves using the toolbar non data aware controls and the properties tool area.
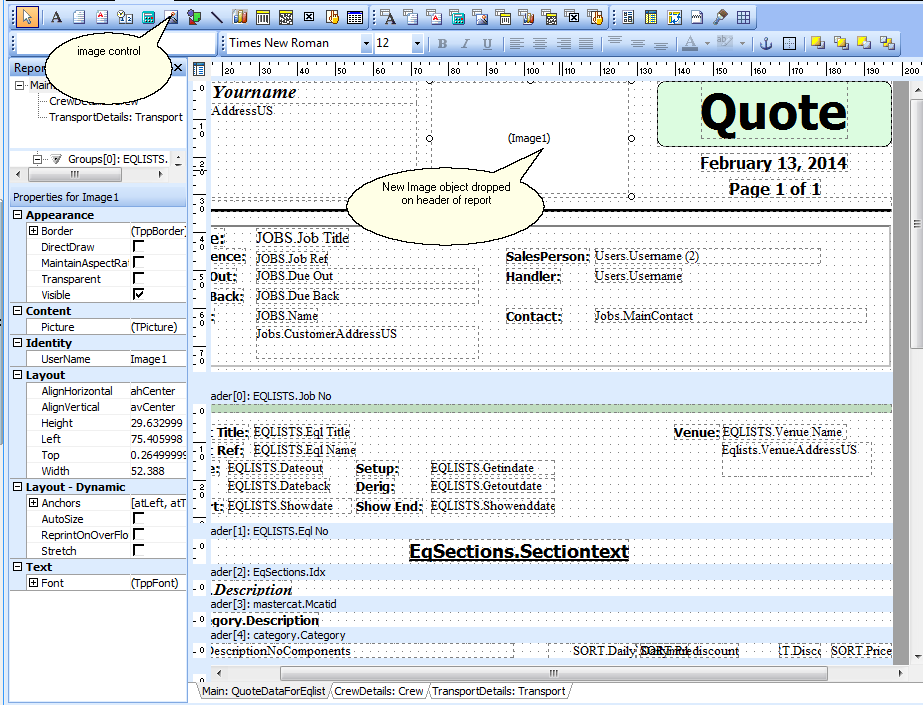
First we click on the Image icon from the toolbar and then click where on the report we wish the logo to appear.
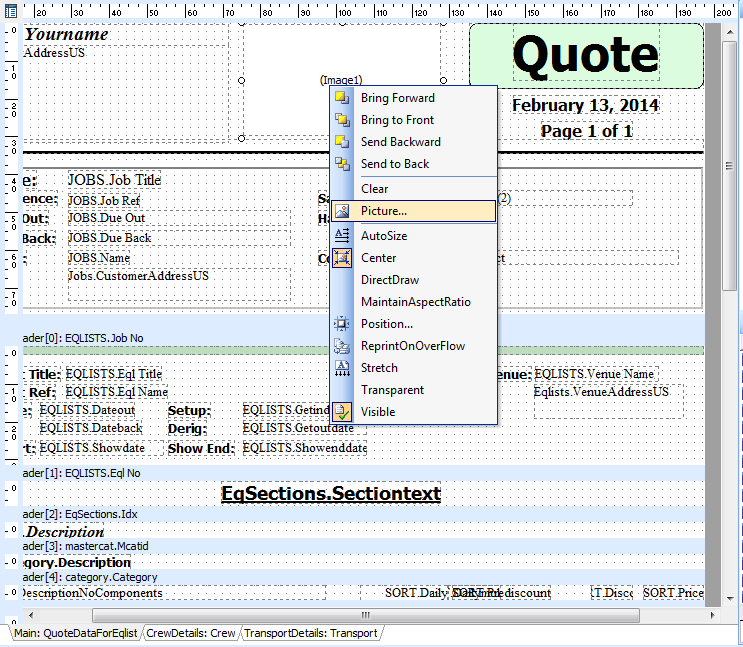
Right Clicking on the blank image allows us to select the picture to use
Having selected a suitable picture to use we can set it to scale to the correct size by right clicking and selecting 'Stretch'

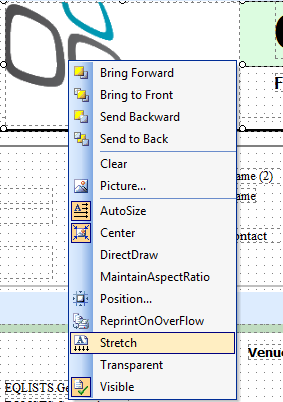

Note: the image is being stretched to fit. This means the aspect ratio may be distorted if you are not careful. You will usually want to select MAINTAIN ASPECT RATIO to avoid stretching of your logo. Also it is best to create the image the same size in pixels as the image object in an external program and the image is in a dpi multiple of 150 so that it scales nicely for pdf export and printing. Failure to observe these precautions may cause a dithered effect on the printout or pdf file.
Meanwhile the box round the quote doesn't match the colours of our log so we will change that.
Firstly select the box on the report by clicking on it.
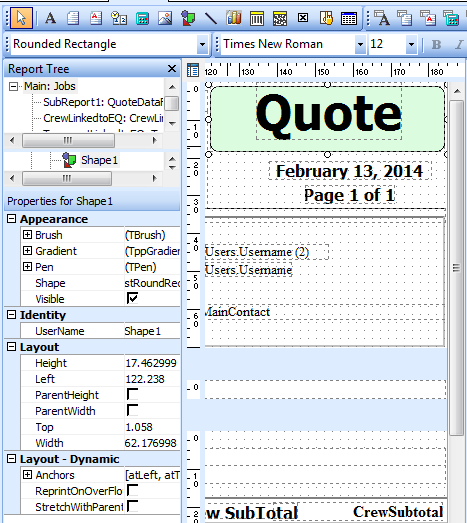
Then on the left hand window click on the + by the brush to expand to show the color (sic) property

select a colour from the drop down list or double click to call up the windows colour editor.
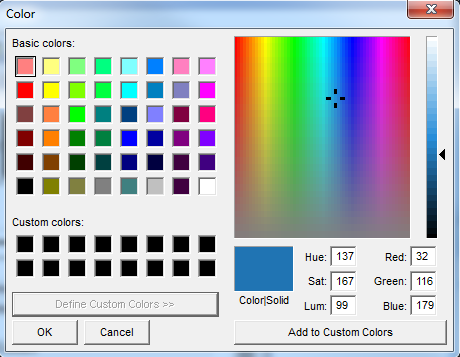
Select a suitable colour and then select OK

Adding a data field
On the header of the report (the part of the report that is only printed once at the top of the report) We may want to print when the job was created.
To do this we use the data tree on the right hand side to find the field (jobs.createddate) and drag and drop it onto the header.
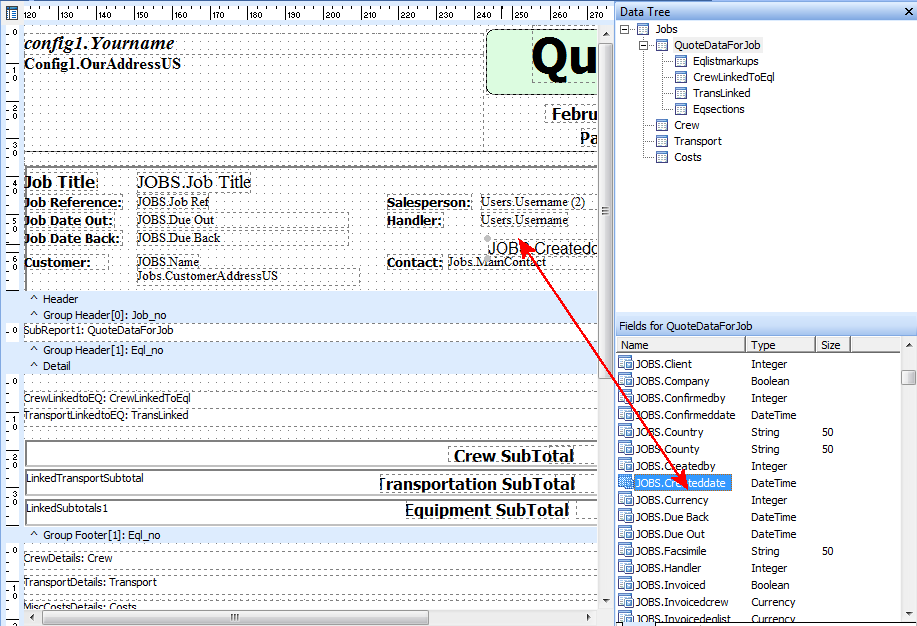
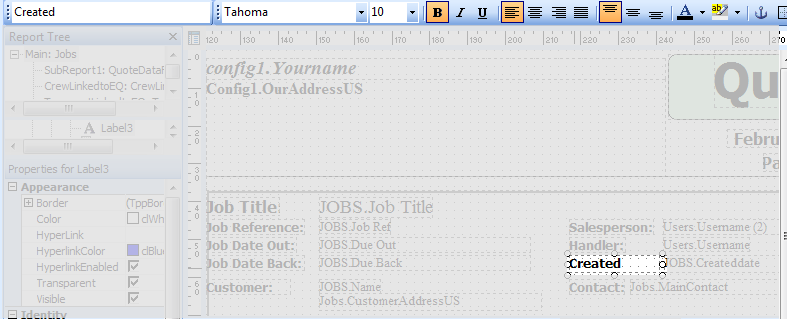
This puts on the list a text box containing the title, followed by the field itself
Then we change the font on the toolbar
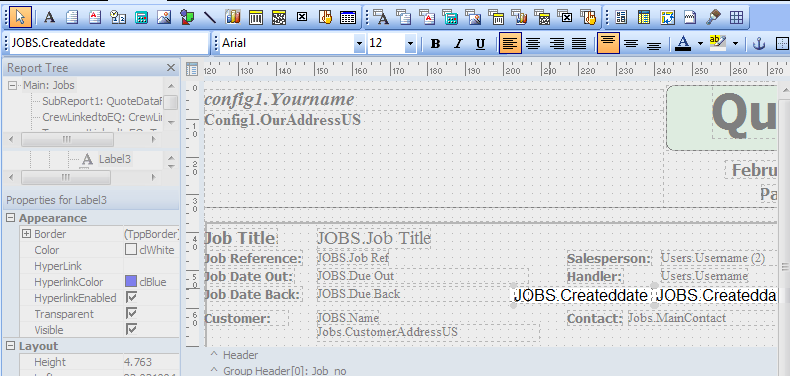
Then by selecting just the label part we can set the caption in the toolbar to suit.
