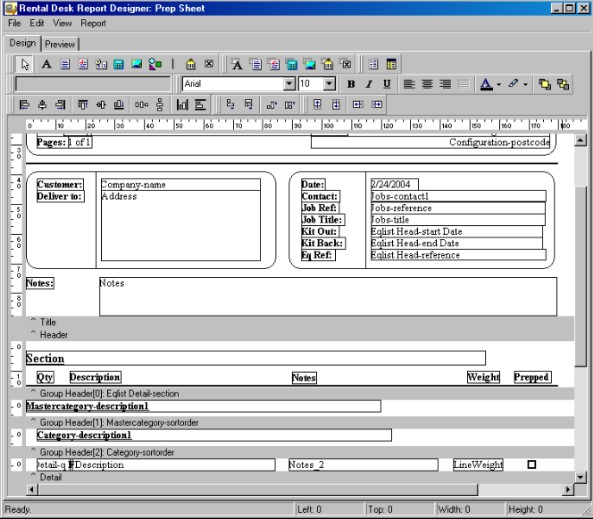
Opening a report for the first time can be somewhat intimidating. If you are overwhelmed by the amount of information on screen, simply click the Preview Tab and you will be able to view the report as it would appear on paper.
The Design Tab is the working area, and this where you make changes to your report. In many reports you need to break the data into groups in order to make it easier to read and understand. These groups are visually represented by the grey bands on the report. Within these groups are components. Components are the fields that display the data stored in RentalDesk, as well as lines, text and logos. Standard components are things such as text, lines, pictures and system calculations. Data Components are things such as data fields and calculations that use your RentalDesk data. The RentalDesk Report Designer includes standard functions used for adjusting these fields, lines and text.


